Stunner

Overview

  • Stunner is the only system that pulls together UV/Vis concentration and dynamic light scattering on the same 2 μL sample.
  • Nail down your lipid nanoparticle quality by knocking particle concentration, size, mass, detection of aggregates and total RNA off your list in one shot.
  • Rack up protein concentration, sizing, and aggregate detection, all at once.
  • Dig in to your AAV or AdV to get the total capsid titer and empty/full ratio. Without skipping a beat, you’ll know if your LNPs, proteins or viral vectors are good to go.

The ultimate quantification and sizing tool

LNPs

Particle Concentration

Sizing & polydispersity

Aggregation

Total RNA quant

Biologics

Sizing & polydispersity

Protein quant

Aggregation detection

B22 & kD

Conjugate Characterization

Viral Vectors

Capsid titer

Empty/full ratio

Aggregation

Sizing & polydispersity

  • Teeny sample, tons of info

    Just load 2 μL of sample in a Stunner plate — don’t bother with sample prep or dilution. Each microfluidic circuit has two fixed pathlengths built-in to cover a wide dynamic range of 0.03-275 OD. If you’re dealing with a full plate, get 96 concentration measurements in 10 minutes — add on sizing from multiple angles and have it all done in around two hours. For even heavier workflows, hook it up to your favorite robot to add more oomph.

    • LNPs-

    • Particle Concentration
    • Sizing & polydispersity
    • Aggregation
    • Total RNA quant

    • LNP sizing & quant in one shot

    Stunner sizes up and counts your LNPs by combining DLS and SLS data from a bunch of different angles. Compare different formulations and mixing parameters to see which one gets you the perfect LNP size. From the same experiment, Stunner will tell you which one contains the most LNP particles. Be certain your LNPs are the size you were hoping for and that you have enough of them to see what they can do with the ultimate lnp tool.

    • Count on it

    No matter how large or how many LNPs you have, Stunner deals out accurate sizes and particle counts. Confirm the concentration after any dilution step and see how it affects the size of your LNPs. Keep a close eye on the concentration and size of your LNPs at every step in your process — from formulation screening to scale-up and everything in between.

    • Know what’s up

    Stunner can catch even the tiniest bit of aggregation. Check out your LNP size by intensity distribution first and stay on the lookout for aggregates. If you see aggregation rearing its ugly head, make the switch to mass distribution to see how bad it might be. Beef up your sizing stats and never get fooled by rogue aggregates again.

    • See through the fog

    Cloudy solutions of LNPs and other nanoparticles hang up other techniques but Stunner’s short pathlengths teamed up with UV/Vis get you the answers you need. Cut through all that turbidity with Unmix and check out just the absorbance signal from your payload.

    • Screen at light speed

    Stunner and Sunscreen are the fastest tag-team for LNP screening. Sunscreen creates up to 96 different LNP formulations in 5 hours, then Stunner characterizes the need-to-know info on your LNPs in about 2 hours. Combine UV/Vis, DLS and SLS from multiple angles to get size, payload quant, particle concentration and the average amount of RNA molecules per particle. Stunner always tells the whole lipid nanoparticle story.

    • Biologics-

    • Sizing & polydispersity
    • Protein quant
    • Aggregation detection
    • B22 & kD
    • Conjugate Characterization

    • Ridiculously good data

    Get spot-on precision within 1% and accuracy within 2%. Using two fixed pathlengths, Stunner gets you jaw-dropping data at both low and high protein concentrations and nails the expected concentrations every time. With the smallest sample size, the highest throughput and crazy accurate results, Stunner is hands down the best tool out there for protein quantification.

    • Track down the big boys

    When it comes to the quick and easy detection of aggregates, Stunner pulls rank. See your monomer based on mass, then switch over to intensity to spot even the tiniest bit of aggregation. QC your protein at every step of your process and catch aggregation before it becomes a bigger problem.

    • Get the skinny on proteins

    Stunner serves up spot-on light scattering data for proteins, so you can compare samples head-to-head based on size, intensity, mass and number. Measure the hydrodynamic size, grab polydispersity when you need to check uniformity, and watch your replicates stack up right on top of each other.

    • Feel the attraction

    Stopping aggregation in its tracks is critical. Stunner deals out B22 and kD, indicators of a potentially looming problem, in one simple experiment. All you do is create a quick dilutions series, load it on a plate and you’re good to go. Stunner checks the exact concentrations while light scattering figures out if your protein is attractive (negative slope) or repulsive (positive slope) to itself.

    • Antibody-anything conjugate

    Don’t waste time on complicated workflows to characterize your antibody conjugate. Get size and polydispersity and use Stunner’s Unmix analysis to know everything about your Ab concentration, conjugate concentration and their ratio, all in one go. Untangle everything about your antibody conjugate, whether it’s hooked up to a drug, an oligo or anything else.

    • Viral Vectors

    • Capsid titer
    • Empty/full ratio
    • Aggregation
    • Sizing & polydispersity

    • Look your AAV up and down

    Drop in your AAV and before you can blink, DLS & SLS figure out how many intact capsids you have or if a bunch of aggregates are screwing things up. See empty/full ratio, total protein and total ssDNA in about a minute with UV/Vis. Don’t worry about extinction coefficients or overlapping spectra — Stunner does all the math for you.

    • Know your AAV inside out

    Get to the numbers you actually want — titers. Stunner bridges DLS and UV/Vis data to tally up how many full and empty capsids are present, and how much extra protein and DNA is left over. Take your cleaned up AAV and sneak a peek down to 1012 vg/mL. In just one assay, Stunner’s dye-free, label-free, standard-free, hassle-free workflow tells the whole titer story.

    • Titer for any serotype

    Every AAV is different, but Stunner figures them all out. Pick a preloaded serotype or feed in the specs for your virus and get answers in seconds. Now you can check capsid titers and empty/full ratio as often as you want.

    • Aggregates ruin everything

    Globs of AAV can stand between you and high-quality data for pretty much every assay. DLS checks if your AAV is monodisperse so the rest of your process doesn’t get tripped up by aggregates.

    • Adeno? I do know!

    Get legit adenovirus (AdV) titers down to 109 cp/mL with Stunner’s readouts on total, full and empty capsids without getting thrown off by annoying contaminants like aggregates and extra DNA. Outsmart old school A260 measurements by Unmixing the absorbance of your AdV into protein and dsDNA signal, so you get the low down on what’s really in your sample.

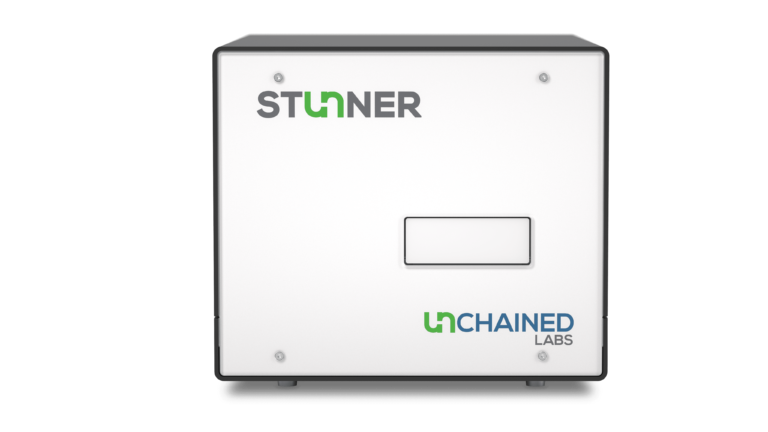
Stunner instrument specifications

Dimensions37 cm W x 54 cm D x 33 cm H; 30.4 kg
ElectricalUniversal input voltage 100-240 V AC, 50-60 Hz
ComputerSeparate computer with Windows 11 included
ConnectionUSB, TCP/IP (Service)
ApprovalCE, FCC, CSA
Regulatory complianceOptional 21CFRp11 software package;,USP and Ph. Eur. Performance verification standards
UV/Vis
Light sourceXenon flash lamp
DetectorsUV/Vis polychromatic spectrophotometer
Wavelength range230-750 nm
Wavelength accuracy≤400 nm: ±1 nm; ≥400 nm: ±2 nm
Spectral resolutionBetter than 2 nm (toluene in hexane)
Absorbance precision (1 cm quartz cuvette)<1 OD: ±0.005 OD st dev1-2 OD: ±0.5% CV
Absorbance accuracy (1 cm quartz cuvette)<1 OD: ±0.01 OD1-2 OD: ±1%
Rotational angle DLS
Light source2 x 660 nm laser diodes
DetectionAvalanche photodiode module
Number of angles1 (DLS), 5 – 30 (RADLS)
Angular range30-42°,110–162°
Size accuracy±2%
Minimum sample concentration0.1 mg/mL lysozyme
Hydrodynamic diameter range0.3–1000 nm
Molecular weight range1 kDa – 10 GDa
Particle concentration range109 – 5x10¹³ particles/mL (dependent on particle size, determined on 80 nm beads)
Stunner plate specifications
Samples per plate96 (12 x 8 microplate format)
Sample retention timeUp to 2 hours
Recommended sample volume2 µL
Pathlength(s)0.1 mm & 0.7 mm path
Measurement time for full plate~10 minutes for UV/Vis only,~1 hour for UV/Vis and DLS (5x 4s x 1 angle),~2 h 15 min for UV/Vis and RADLS (5 x 1s x 7 angles)
Measurement range:OD 10 mm ng/µL dsDNA, mg/mL ave protein mix, 0.03–275 OD 10 mm1.5–13750 ng/µL,0.03–275 mg/mL
Absorbance precision (10 mm pathlength)<1 OD: ±0.01 OD st dev, 1-200 OD: ±1% CV
Absorbance accuracy (10 mm pathlength)<1 OD: ±0.02 OD, 1-200 OD: ±2%

Overview

  • Stunner is the only system that pulls together UV/Vis concentration and dynamic light scattering on the same 2 μL sample.
  • Nail down your lipid nanoparticle quality by knocking particle concentration, size, mass, detection of aggregates and total RNA off your list in one shot.
  • Rack up protein concentration, sizing, and aggregate detection, all at once.
  • Dig in to your AAV or AdV to get the total capsid titer and empty/full ratio. Without skipping a beat, you’ll know if your LNPs, proteins or viral vectors are good to go.

Capabilities

  • Teeny sample, tons of info

    Just load 2 μL of sample in a Stunner plate — don’t bother with sample prep or dilution. Each microfluidic circuit has two fixed pathlengths built-in to cover a wide dynamic range of 0.03-275 OD. If you’re dealing with a full plate, get 96 concentration measurements in 10 minutes — add on sizing from multiple angles and have it all done in around two hours. For even heavier workflows, hook it up to your favorite robot to add more oomph.

    • LNPs-

    • Particle Concentration
    • Sizing & polydispersity
    • Aggregation
    • Total RNA quant

    • LNP sizing & quant in one shot

    Stunner sizes up and counts your LNPs by combining DLS and SLS data from a bunch of different angles. Compare different formulations and mixing parameters to see which one gets you the perfect LNP size. From the same experiment, Stunner will tell you which one contains the most LNP particles. Be certain your LNPs are the size you were hoping for and that you have enough of them to see what they can do with the ultimate lnp tool.

    • Count on it

    No matter how large or how many LNPs you have, Stunner deals out accurate sizes and particle counts. Confirm the concentration after any dilution step and see how it affects the size of your LNPs. Keep a close eye on the concentration and size of your LNPs at every step in your process — from formulation screening to scale-up and everything in between.

    • Know what’s up

    Stunner can catch even the tiniest bit of aggregation. Check out your LNP size by intensity distribution first and stay on the lookout for aggregates. If you see aggregation rearing its ugly head, make the switch to mass distribution to see how bad it might be. Beef up your sizing stats and never get fooled by rogue aggregates again.

    • See through the fog

    Cloudy solutions of LNPs and other nanoparticles hang up other techniques but Stunner’s short pathlengths teamed up with UV/Vis get you the answers you need. Cut through all that turbidity with Unmix and check out just the absorbance signal from your payload.

    • Screen at light speed

    Stunner and Sunscreen are the fastest tag-team for LNP screening. Sunscreen creates up to 96 different LNP formulations in 5 hours, then Stunner characterizes the need-to-know info on your LNPs in about 2 hours. Combine UV/Vis, DLS and SLS from multiple angles to get size, payload quant, particle concentration and the average amount of RNA molecules per particle. Stunner always tells the whole lipid nanoparticle story.

    • Biologics-

    • Sizing & polydispersity
    • Protein quant
    • Aggregation detection
    • B22 & kD
    • Conjugate Characterization

    • Ridiculously good data

    Get spot-on precision within 1% and accuracy within 2%. Using two fixed pathlengths, Stunner gets you jaw-dropping data at both low and high protein concentrations and nails the expected concentrations every time. With the smallest sample size, the highest throughput and crazy accurate results, Stunner is hands down the best tool out there for protein quantification.

    • Track down the big boys

    When it comes to the quick and easy detection of aggregates, Stunner pulls rank. See your monomer based on mass, then switch over to intensity to spot even the tiniest bit of aggregation. QC your protein at every step of your process and catch aggregation before it becomes a bigger problem.

    • Get the skinny on proteins

    Stunner serves up spot-on light scattering data for proteins, so you can compare samples head-to-head based on size, intensity, mass and number. Measure the hydrodynamic size, grab polydispersity when you need to check uniformity, and watch your replicates stack up right on top of each other.

    • Feel the attraction

    Stopping aggregation in its tracks is critical. Stunner deals out B22 and kD, indicators of a potentially looming problem, in one simple experiment. All you do is create a quick dilutions series, load it on a plate and you’re good to go. Stunner checks the exact concentrations while light scattering figures out if your protein is attractive (negative slope) or repulsive (positive slope) to itself.

    • Antibody-anything conjugate

    Don’t waste time on complicated workflows to characterize your antibody conjugate. Get size and polydispersity and use Stunner’s Unmix analysis to know everything about your Ab concentration, conjugate concentration and their ratio, all in one go. Untangle everything about your antibody conjugate, whether it’s hooked up to a drug, an oligo or anything else.

    • Viral Vectors

    • Capsid titer
    • Empty/full ratio
    • Aggregation
    • Sizing & polydispersity

    • Look your AAV up and down

    Drop in your AAV and before you can blink, DLS & SLS figure out how many intact capsids you have or if a bunch of aggregates are screwing things up. See empty/full ratio, total protein and total ssDNA in about a minute with UV/Vis. Don’t worry about extinction coefficients or overlapping spectra — Stunner does all the math for you.

    • Know your AAV inside out

    Get to the numbers you actually want — titers. Stunner bridges DLS and UV/Vis data to tally up how many full and empty capsids are present, and how much extra protein and DNA is left over. Take your cleaned up AAV and sneak a peek down to 1012 vg/mL. In just one assay, Stunner’s dye-free, label-free, standard-free, hassle-free workflow tells the whole titer story.

    • Titer for any serotype

    Every AAV is different, but Stunner figures them all out. Pick a preloaded serotype or feed in the specs for your virus and get answers in seconds. Now you can check capsid titers and empty/full ratio as often as you want.

    • Aggregates ruin everything

    Globs of AAV can stand between you and high-quality data for pretty much every assay. DLS checks if your AAV is monodisperse so the rest of your process doesn’t get tripped up by aggregates.

    • Adeno? I do know!

    Get legit adenovirus (AdV) titers down to 109 cp/mL with Stunner’s readouts on total, full and empty capsids without getting thrown off by annoying contaminants like aggregates and extra DNA. Outsmart old school A260 measurements by Unmixing the absorbance of your AdV into protein and dsDNA signal, so you get the low down on what’s really in your sample.

Specifications

Stunner instrument specifications
Dimensions37 cm W x 54 cm D x 33 cm H; 30.4 kg
ElectricalUniversal input voltage 100-240 V AC, 50-60 Hz
ComputerSeparate computer with Windows 11 included
ConnectionUSB, TCP/IP (Service)
ApprovalCE, FCC, CSA
Regulatory complianceOptional 21CFRp11 software package;,USP and Ph. Eur. Performance verification standards
UV/Vis
Light sourceXenon flash lamp
DetectorsUV/Vis polychromatic spectrophotometer
Wavelength range230-750 nm
Wavelength accuracy≤400 nm: ±1 nm; ≥400 nm: ±2 nm
Spectral resolutionBetter than 2 nm (toluene in hexane)
Absorbance precision (1 cm quartz cuvette)<1 OD: ±0.005 OD st dev1-2 OD: ±0.5% CV
Absorbance accuracy (1 cm quartz cuvette)<1 OD: ±0.01 OD1-2 OD: ±1%
Rotational angle DLS
Light source2 x 660 nm laser diodes
DetectionAvalanche photodiode module
Number of angles1 (DLS), 5 – 30 (RADLS)
Angular range30-42°,110–162°
Size accuracy±2%
Minimum sample concentration0.1 mg/mL lysozyme
Hydrodynamic diameter range0.3–1000 nm
Molecular weight range1 kDa – 10 GDa
Particle concentration range109 – 5x10¹³ particles/mL (dependent on particle size, determined on 80 nm beads)
Stunner plate specifications
Samples per plate96 (12 x 8 microplate format)
Sample retention timeUp to 2 hours
Recommended sample volume2 µL
Pathlength(s)0.1 mm & 0.7 mm path
Measurement time for full plate~10 minutes for UV/Vis only,~1 hour for UV/Vis and DLS (5x 4s x 1 angle),~2 h 15 min for UV/Vis and RADLS (5 x 1s x 7 angles)
Measurement range:OD 10 mm ng/µL dsDNA, mg/mL ave protein mix, 0.03–275 OD 10 mm1.5–13750 ng/µL,0.03–275 mg/mL
Absorbance precision (10 mm pathlength)<1 OD: ±0.01 OD st dev, 1-200 OD: ±1% CV
Absorbance accuracy (10 mm pathlength)<1 OD: ±0.02 OD, 1-200 OD: ±2%

Start Your New Experience With Us